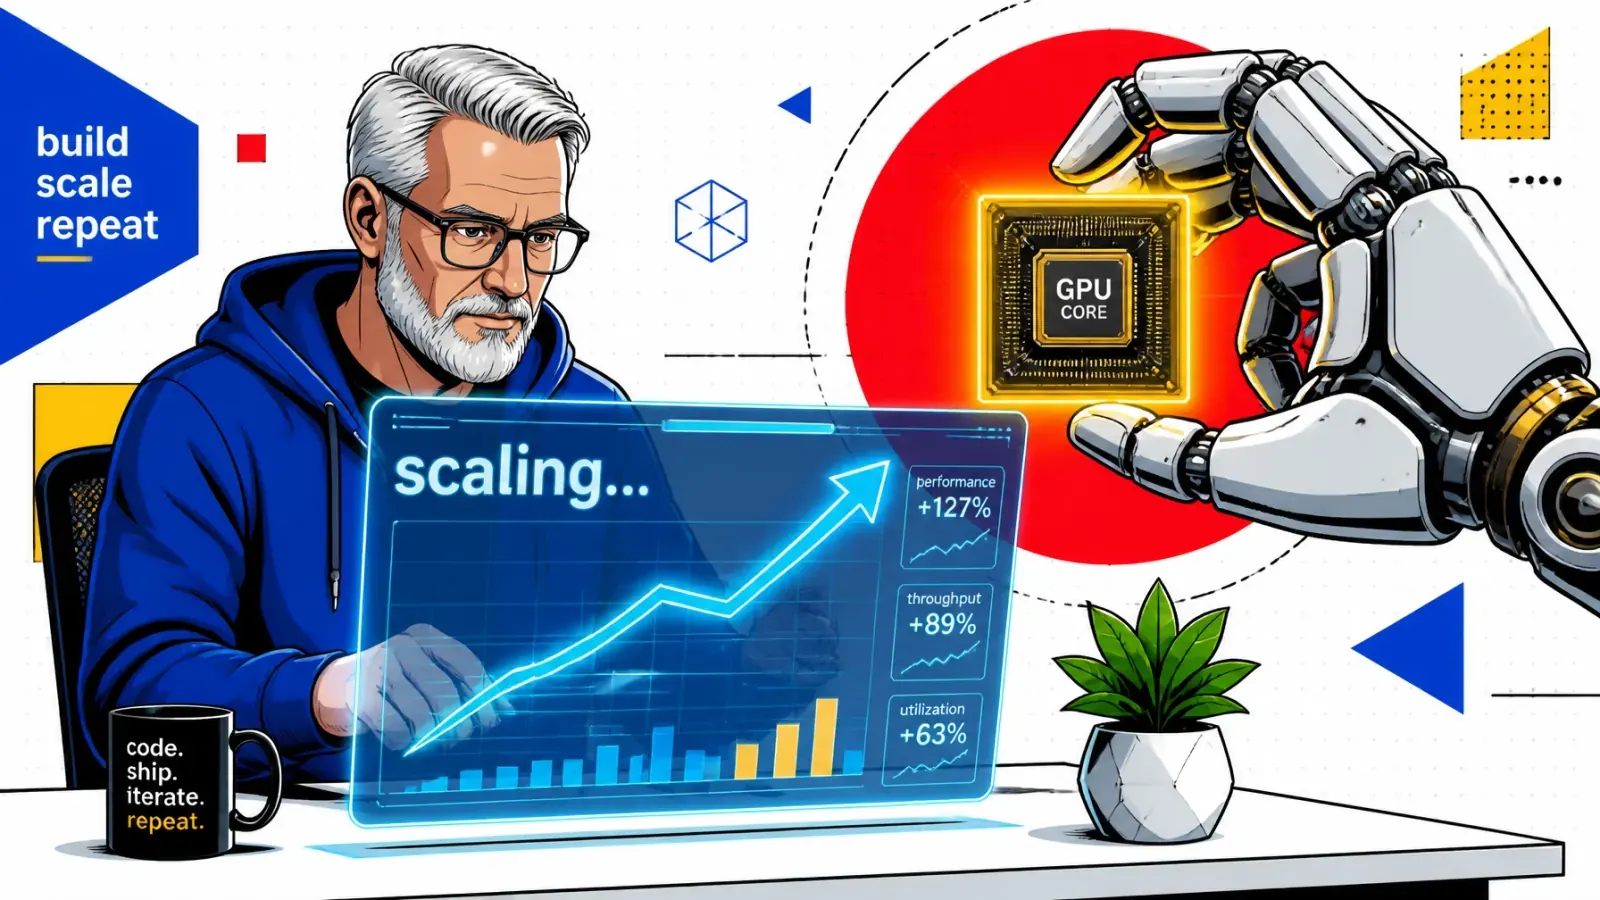
When CPU sits at 20% and inference requests time out, your autoscaler is watching the wrong number. Scale AI workloads on queue depth, KV-cache pressure and time to first token.
Your AI app is lagging and users are complaining, but the cloud dashboard says everything is fine. CPU hovers at a comfortable 20% while inference requests time out.
The scaling trap
Traditional auto-scaling was built for web servers, where CPU and memory are the bottlenecks. For LLM inference, those numbers tell you very little.
If you wait for CPU to hit 80% before adding a pod, the service is in trouble long before the second instance finishes booting. GPU-bound workloads need a different playbook.
Scale on pressure
To run a cost-effective AI SaaS, move past reactive hardware metrics. Scale on queue pressure, cache pressure and how fast users get their first token.
Why CPU-based auto-scaling misleads you
The Kubernetes Horizontal Pod Autoscaler (HPA) is most often set up to watch CPU utilization. For a Laravel or Node.js API, that works: more requests mean more CPU cycles.
The work moved to the GPU
AI models are different. The CPU handles tokenization, request routing and HTTP headers. The heavy lifting happens on the GPU.
I’ve seen production clusters where the GPU is pinned at 100% while the CPU sits idle. The autoscaler sees low CPU, decides the pods are fine and never adds a replica, while the queue keeps growing.

GPU utilization vs occupancy
When you start monitoring GPUs, you meet two confusing metrics: utilization and occupancy.
Utilization is a duty cycle
GPU utilization is the percentage of time the GPU was running work during a sample period. It lags. By the time it reads 90%, your request queue may have been building for a while.
Occupancy is finer-grained
Occupancy measures how many warps are active on each streaming multiprocessor (SM) compared with the maximum. You can have high utilization and low occupancy if your batch size is too small.
For scaling, treat utilization as a baseline and look at what happens before a request even reaches the GPU.
Queue depth: your best leading indicator
To stop fires before they start, watch queue depth. In vLLM it’s the number of requests waiting for a slot in the engine, exported as vllm:num_requests_waiting. SGLang exposes a similar metric.
Scale before latency climbs
Queue depth predicts latency. If your model handles 16 concurrent requests before P99 latency starts to climb, set the scaling trigger at 12. To get a real P99 from your own response times, paste them into my latency percentile calculator.
Scaling on queue depth adds capacity while the current hardware is still inside your SLO. That buys the head start you need to pull a fresh container and load 20 GB of model weights into GPU memory.
| Signal | vLLM metric | What it tells you |
|---|---|---|
| Waiting requests | vllm:num_requests_waiting | Work is piling up before the engine |
| KV-cache usage | vllm:kv_cache_usage_perc | How close you are to preemptions |
| Preemptions | vllm:num_preemptions | Requests are being evicted and recomputed |
| Time to first token | vllm:time_to_first_token_seconds | What users feel when they hit enter |
| CPU utilization | (node metric) | Tokenization and HTTP load, rarely the bottleneck |
In Prometheus, the counter shows up as vllm:num_preemptions_total and the TTFT histogram as vllm:time_to_first_token_seconds_bucket.
Token velocity and the KV cache
In generative AI, requests vary a lot in size. A 10-token summary is light. A 4,000-token RAG analysis is heavy.
When the cache fills up
The KV cache is the GPU memory that stores attention keys and values for in-flight sequences. When it’s nearly full, the engine preempts a request to free blocks.
In vLLM V1, the default preemption mode is recompute: the evicted request’s cache is dropped, and its prompt plus generated tokens are processed again when it resumes. Latency jumps, and P99 starts to look like a mountain range.
Scale on two numbers
I recommend scaling on a combination of:
- Token velocity: total tokens per second across all active instances.
- KV-cache pressure: the share of cache blocks in use (
vllm:kv_cache_usage_perc).
When the cache is full, low GPU utilization doesn’t help. You can’t fit more work on that chip, so you add replicas.
Scale on CPU
Scale on pressure
Predictive scaling with ARIMA
Reactive scaling always plays catch-up. Even with fast boots, there’s a delay. For apps with predictable traffic, I use ARIMA (Auto-Regressive Integrated Moving Average) models to forecast load.
Warm before the spike
If traffic always spikes at 9:00 am on Mondays, I don’t wait for the queue to grow. A time-series forecast brings up the base-load pods at 8:55 am.
You still pay for what you use, and the capacity is there before the first user clicks “Generate.”
Practical steps for your stack
Here is how I structure it:
- Use KEDA. The Kubernetes Event-Driven Autoscaler can scale on Prometheus queries, like waiting requests or P99 latency, instead of CPU alone.
- Set TTFT SLOs. Time to first token shapes how fast the app feels. If TTFT P99 passes 500 ms, you need more replicas.
- Use a composite signal. Don’t rely on one metric. Combine queue depth, cache pressure and GPU utilization. Once you have several replicas, route with GPU-aware load balancing so traffic lands on the least-loaded GPU.
- Check your RAG pipeline. Sometimes the scaling issue is a retrieval issue. Slow vector search makes the engine wait and holds GPU slots. These common RAG mistakes help you rule out an upstream bottleneck.
- Handle retries in the app. For Shopify apps or custom SaaS, make sure your agentic workflows retry gracefully while capacity scales up.
Key takeaways
- CPU is the wrong trigger for GPU inference. Watch the queue and the cache.
- Queue depth leads latency. Scale before your SLO breaks, not after.
- KV-cache pressure predicts preemptions and the latency spikes they cause.
- Use KEDA to scale on vLLM’s Prometheus metrics, and track TTFT as the user-facing SLO.
- Forecast known peaks so replicas finish loading weights before traffic arrives.
Smarter triggers save money on idle GPUs and spare your users the “thinking…” spinner. If you’re running inference on Kubernetes, here’s how I help teams scale AI workloads on the right signals, or drop me a note.
Are you still scaling on CPU, or have you moved to queue-based triggers yet?