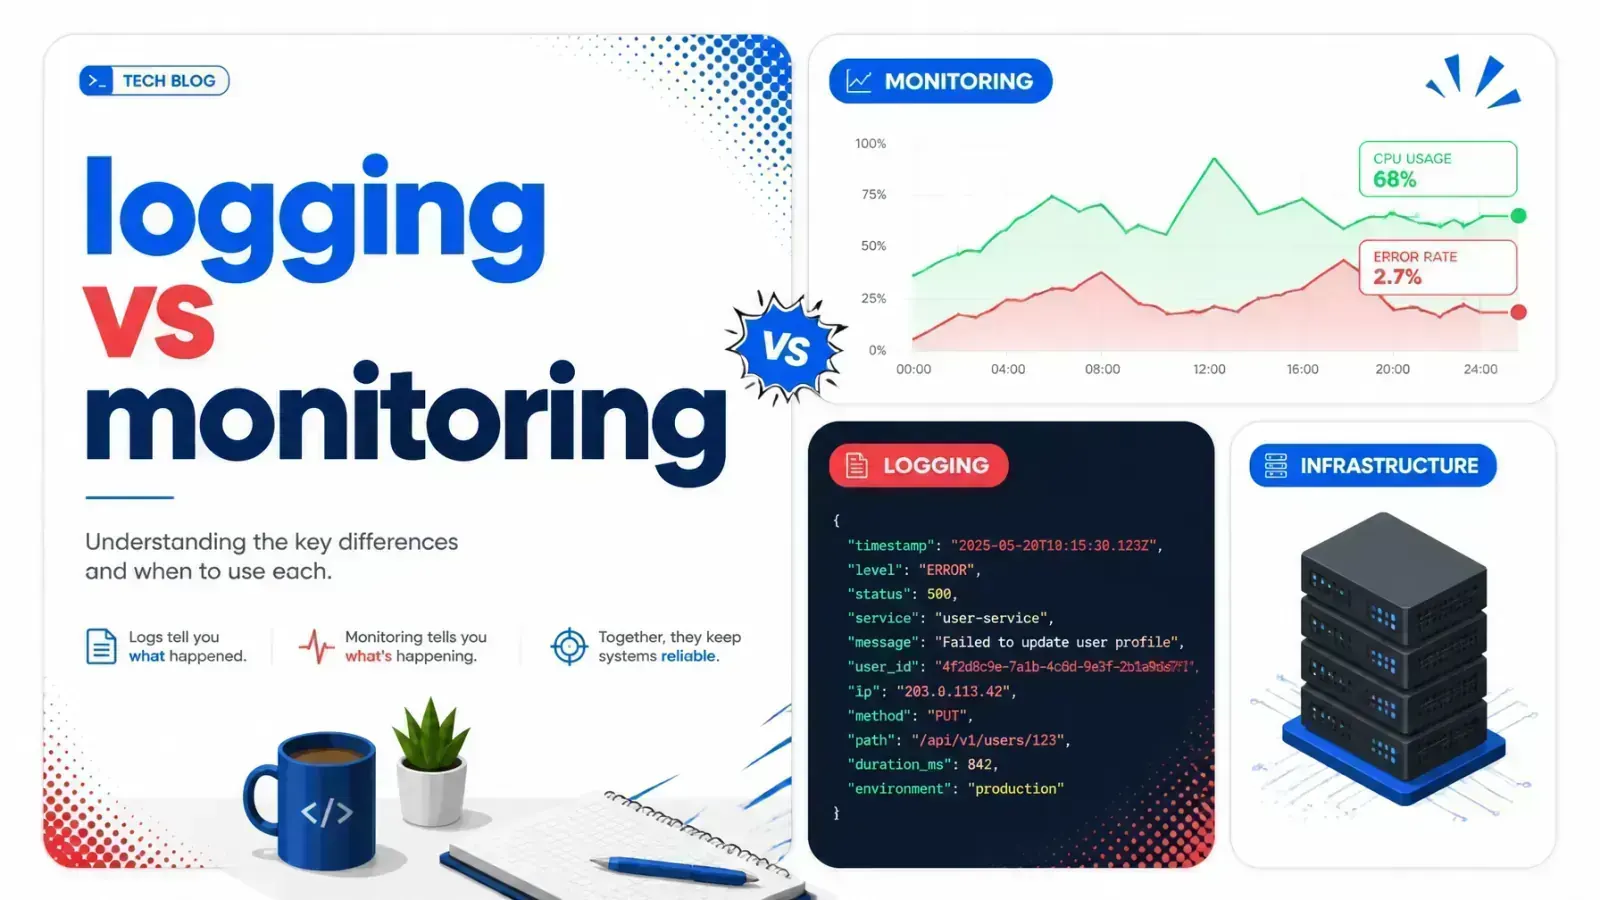
Your dashboard shows a latency spike. It can’t tell you why the database connection is timing out. That gap is the difference between monitoring and logging.
Your production environment is failing and customers are reporting 500 errors. You check your dashboard and see a latency spike, but the graph doesn’t say why.
You dive into your text files for the stack trace, but the logs are unstructured and impossible to search during a crisis.
Two pillars, often mixed up
Engineering teams often blur these two pillars of observability. The result is slow incident response and fragile systems.
Picking tools is only part of it. You need a clear strategy for your DevOps solutions that keeps availability high and debugging fast. One is the pulse of your system. The other is the forensic record.
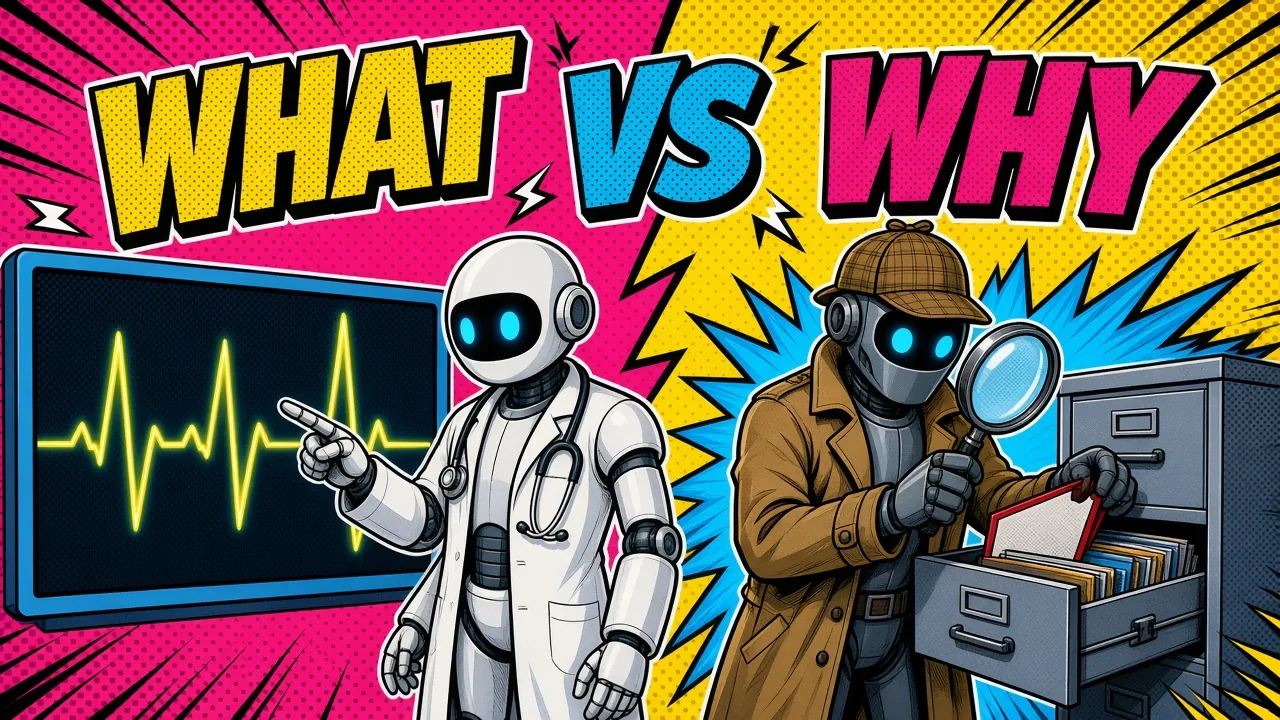
Logging vs monitoring: what vs why
Monitoring tracks metrics over time to understand the state of a system. It answers “Is the system healthy?” by looking at numbers.
You monitor CPU usage, memory and request latency. When a metric crosses a threshold, your monitoring system fires an alert.
Logs tell the story
Logging records discrete events inside an application or infrastructure. It answers “What exactly happened?” by giving context.
A log entry might hold a user ID, a timestamp and the error message from a failed Laravel job. Logs are granular and tell the story of a single request through your stack.
| Feature | Monitoring | Logging |
|---|---|---|
| Data type | Metrics (numbers/counters) | Events (text/structured data) |
| Purpose | Detection and health | Diagnosis and forensics |
| Frequency | Aggregated over time | Recorded per occurrence |
| Alerting | Threshold-based (e.g., CPU > 80%) | Event-based (e.g., Fatal Error) |
| Storage | Time-series databases | Log aggregators/search engines |
Monitoring: the pulse of your infrastructure
Monitoring focuses on numbers. It is the first line of defense in any production environment.
By watching trends, you can predict failures before they happen. A slow rise in memory use over 48 hours might point to a memory leak in a long-running Docker container.
The four golden signals
In a stack using tools like Coolify and Docker, monitoring shows whether your containers perform as expected. Focus on the “Four Golden Signals”:
- Latency: the time it takes to serve a request.
- Traffic: the demand placed on the system.
- Errors: the rate of requests that fail.
- Saturation: how “full” your service is.
Alert on what users feel
Good monitoring needs meaningful thresholds. An alert that fires every time CPU hits 70% is noise if your app is meant to be CPU-intensive.
Define Service Level Objectives (SLOs) that match user experience. If users don’t notice a 100ms delay, don’t wake up an engineer for it.
Logging: the black box recorder
If monitoring tells you the plane is losing altitude, logging tells you why the engine stalled. Logs give you the evidence to debug complex issues.
In a distributed system, one user action might touch several services. Without central logging, finding the root cause is like finding a needle in a haystack.
Structure your logs
A common mistake is using unstructured logs. Text lines like [2026-06-21] Error: something went wrong are hard for machines to parse.
Modern teams use structured logging, formatting each log as a JSON object. You can then filter and query on fields like user_id, request_id or environment. When a log line won’t parse, my JSON formatter points to the exact character.
{
  "timestamp": "2026-06-21T14:30:05Z",
  "level": "error",
  "message": "Payment gateway timeout",
  "context": {
    "user_id": 4502,
    "order_id": "ORD-9921",
    "gateway": "stripe",
    "attempt": 3
  },
  "request_id": "req-a1b2c3d4"
}
Trace one request everywhere
Including a request_id in every log entry lets you trace a single request across your infrastructure. This matters a lot in Shopify development, where webhooks and API calls often chain together.
Unstructured
Error: something went wrong. No user, no order, no request ID. You grep text files and hope.Structured
level, user_id, order_id and request_id. One query finds every line for that request.Observability in the Laravel ecosystem
Laravel has a capable logging system built on the Monolog library. Out of the box, it supports channels such as single files, daily rotated files, syslog and Slack, plus stack channels that send one message to several channels at once.
Ship logs off the server
In production, configure Laravel to ship logs to a central service. Sending them to a service like Logstash, Sentry or Datadog means you don’t lose data when a server instance is terminated.
Watch your queues
Monitoring a Laravel app means more than checking that the web server is up. Watch the health of your background queues too.
If your Redis queue backs up, customers might not get order confirmation emails or account activation links. Tools like Laravel Pulse or Horizon give real-time monitoring for these app-level metrics.
Close the loop
A common pattern is to log exceptions to a dedicated tracker while watching the error rate on a dashboard. A spike in the “Error Rate” metric prompts you to check the “Exception Logs” for the actual stack trace.
Scaling Shopify apps with metrics and logs
High-scale Shopify apps need their own approach to logging and monitoring. They live at the mercy of external API rate limits and webhook delivery speed.
If your app handles thousands of webhooks per minute, you can’t log every successful event to a text file. You will quickly run out of disk space.
Monitor the limits, log the failures
Instead, use monitoring to track the “Webhook Success Rate” and your API rate-limit use. Shopify’s GraphQL Admin API meters calls by calculated query cost using a leaky bucket (on the Standard plan, your quota restores at 100 points per second, and a single query can’t cost more than 1,000 points). The REST Admin API uses a request-based bucket. To see how fast a full sync can run inside those limits, use my Shopify rate limit planner.
Watch how close you run to those ceilings, then use logging to investigate the specific failed payloads when the success rate drops.
Agents need logs too
This matters even more for agentic commerce apps where AI agents act on behalf of a merchant. If an agent fails to update an inventory count, you need the specific log to understand the logic failure.
For Shopify Plus merchants, performance matters a lot. Monitoring the “Time to First Byte” (TTFB) of your app’s embedded components makes sure you aren’t slowing down the merchant’s admin.
The DevOps synergy: linking logs and metrics
Mature engineering teams don’t treat logging and monitoring as separate silos. They link them.
When an alert fires in your monitoring tool, it should link straight to the logs for that timeframe and service.
Correlation IDs
This is often done with “Correlation IDs.” When a request enters your system, you give it a unique ID.
That ID is attached to every log entry and trace written during the request. When a metric spikes, you filter the logs for that time window and follow the IDs to the requests that caused it.
Monitor your logs
You should also monitor your logs. Counting how often certain log patterns appear gives you new metrics.
If “Database connection lost” shows up more than five times in a minute, turn that log event into a metric that triggers a high-priority alert.

Best practices for technical teams
- Automate everything: your monitoring agents and logging drivers belong in your base server image or Dockerfile.
- Log levels matter: use
debugfor local development,infofor general production events, anderrororcriticalfor things that need a human. - Protect PII: never log personal data like passwords, credit card numbers or auth tokens. Use log masking to strip sensitive data.
- Set retention policies: metrics are small and can be kept for months. Logs are large and expensive, so balance cost against your need for history.
- Monitor the monitors: make sure your monitoring system itself is healthy. A silent monitoring system is a dangerous liability.
Key takeaways
- Monitoring detects that a problem exists. Logging explains why it happened.
- Metrics are numbers. Logs are detailed event records.
- Use structured JSON logging to make your data searchable and machine-readable.
- In Laravel, watch your queues so background tasks keep completing.
- In Shopify apps, track API rate limits as a primary health metric.
- Link logs and metrics with correlation IDs to cut Mean Time to Resolution (MTTR).
- Base monitoring on user-focused SLOs to avoid alert fatigue.
If you’re building observability for a Laravel or Shopify app, here’s how I help teams set up structured logs, SLO alerts and correlation IDs.
How do you tell a noisy alert from a real system failure in your current production stack?